by Amy Schmitz Weiss | Associate Professor, SDSU School of Journalism and Media Studies
What is a sensor?
“A device that detects and responds to some type of input from the physical environment. The specific input could be light, heat, motion, moisture, pressure, or any one of a great number of other environmental phenomena. The output is generally a signal that is converted to human-readable display at the sensor location or transmitted electronically over a network for reading or further processing.”
Source: http://whatis.techtarget.com/definition/sensor
What is the sensor for this project?
This sensor sought to measure air quality in different areas of San Diego. Specifically, we examined the levels of particulate matter, PM2.5, those particles that are less than 2.5 micrometers in diameter. These particles are about 1/30th the average width of a human hair. More information on PM2.5 can be found on the EPA website.
What does the sensor do?
The sensor takes in particles and sends quantitative information every 30 seconds to a small computer, called an Arduino, that shows on the LCD display the mass concentration of particles in the air for that immediate vicinity.
How was it built?
The sensor was developed over several months. Associate Professor Schmitz Weiss, Lecturer Kevin Robinson, Sensor Consultant Steve Birch, inewsource Executive Director Lorie Hearn and inewsource data journalist Joe Yerardi helped in the process of testing different sensors last fall. The latest iteration was completed in January.
What is inside the sensor kit?

As shown, the sensor kit uses open-source technology that allows us to customize its functions.
The sensor kit has a particulate matter sensor (which takes in tiny particulates from the air) and a gas sensor (which takes in different gases, such as LPG, i-butane, methane, alcohol, hydrogen, smoke, etc.).
The sensor kit has a computer (Arduino board) that sends a reading to the LCD display of the mass concentrations of the particulates in the air and gases in the air.
The computer provides a reading of the particulate matter and gases every 30 seconds. The data collected is saved onto a mini-SD card that is housed on the Arduino board.
The LCD display would provide the following information:
- % LPO
- Concentration
- Gas Instant Voltage
- Gas Max Voltage
- Timer
The sensor kit is powered through either a standard power cord or a special phone charger.
How was the sensor used in this project?
Beginning in January, the students assembled their sensors using the sensor equipment we provided. They started with spot measurements of the air quality in different parts of the SDSU campus and then moved on to monitor different areas of San Diego over the course of the spring semester. These deployments allowed the students to get comfortable with the technology, learn how it functions and see how the data readings were coming in.
Community members were also able to assemble their own sensors. During the spring, some purchased sensor equipment and made a replica of our sensor. Others were able to receive a free sensor thanks to the grant for this project. Community members deployed sensors in their backyards.We are still receiving data from some of those locations, and will be publishing it soon.
How were the sensor values collected and calculated?
For this project, the raw data were collected from the sensors via the mini-SD card and uploaded to a database on the web.
As this project focused on PM2.5, the raw data from this sensor was converted into PM2.5 values. These values were calculated using a special co-location experiment that was done with the SDSU Graduate School of Public Health.
Here are the specific details of that co-location experiment, written by Professor Jenny Quintana in the Graduate School of Public Health:
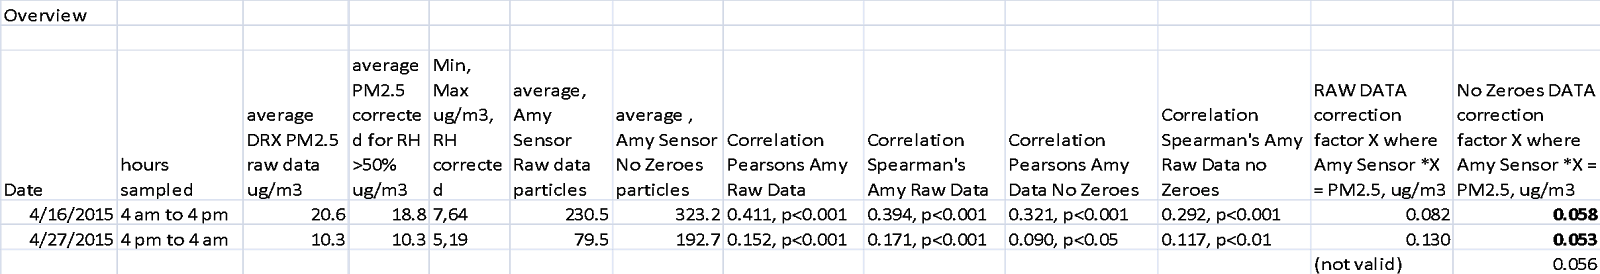
The sensor used in this project to collect particle number concentration for the estimation of particulate matter less than 2.5 micrometers in diameter (PM2.5) concentrations (Shinyei, PPD42NS) was co-located with another particle monitor in several test experiments conducted by Adriana Pererya, an undergraduate Health Science student in Public Health and Social Work under the guidance of Professor Jenny Quintana in the Graduate School of Public Health. These co-location experiments included having our sensor placed in the same place and time as a DustTrak DRX Aerosol Particle Monitors (TSI, Inc, Shoreview MN), which estimates particle mass in air every 30 seconds for the size fractions of PM1, PM2.5, PM10, and total PM. The readout is in estimated µg/m3, the unit used by the US EPA for air monitoring. Also, relative humidity and temperature were collected every 30 seconds by a HOBO monitor (Onset Computer Corp, Bourne, MA). Side by side measurements were collected outdoors on a balcony in Mid-City area near SDSU over two 12 -hour periods in April 2015. During this time, the humidity was generally low, but any data collected by the DRX values when RH was > 50% were corrected per Chakrabarti et al., 2004. These higher RH values occurred during the night hours. The data that was collected from both sensors was reviewed and a conversion calculation was created. Due to the occurrence of zero values in the Shinyei (Sensor box) data, conversion values were calculated after removing the zero values from the data. Considerable variability in the Shinyei instrument was observed, so that moving averages or other smoothing is recommended. This preliminary conversion calculation from the Shinyei sensor to PM2.5 in µg/m3 as determined by the DRX (Run 1correction factor was 0.058, run 2 was 0.053) is Shinyei particle count* 0.056 = PM2.5 in µg/m3.
However, this conversion factor is likely not valid over wider ranges of PM2.5 concentrations or in higher humidity days, or under conditions with different particle size distributions. Further co-locations need to be conducted.
Chakrabarti, B.; Fine, P.M.; Delfino, R.; Sioutas, C. Performance evaluation of the active-flow personal DataRAM PM2.5 mass monitor (Thermo Anderson pDR-1200) designed for continuous personal exposure measurements. Atmos. Environ. 2004, 38, 3329–3340, doi:10.1016/j.atmosenv.2004.03.007.
What is sensor journalism?
Sensor journalism is the act of using sensors in the news-gathering and reporting process to gather and report data. Such data can include but is not limited to information collected about water, air, temperature, wind and soil.
Click here to see more from “What’s in the Air”
Amy Schmitz Weiss is an associate professor in the School of Journalism and Media Studies at San Diego State University